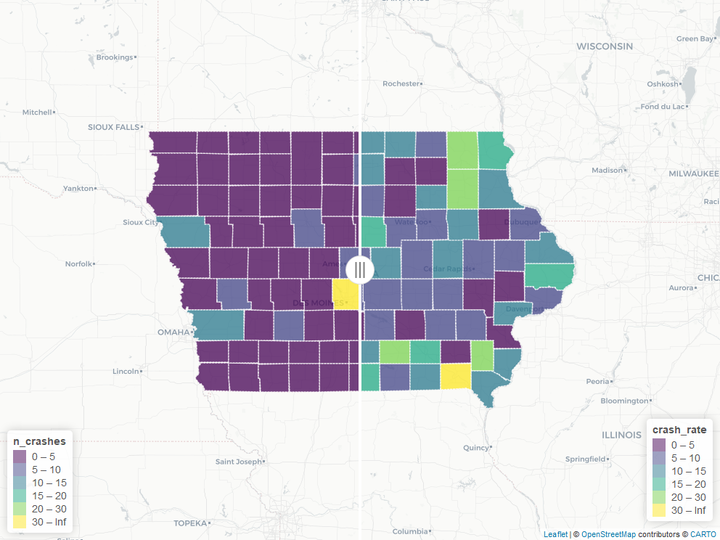
In the recent years, RStudio has ported Leaflet, a widely used open-source JavaScript library for creating interactive maps, to R as a package called leaflet and has made it possible to create maps in R using the familiar ggplot2 style syntax. Additionally, a bunch of Leaflet plugins that extend Leaflet's functionalities have also been ported to R by the community members, enabling users to create a variety of maps with ease. In this talk, I will demonstrate the use of the leaflet R package for visualizing fatal crash data for the state of Iowa in many different ways, such as heat maps, choropleth maps, etc. Towards the end of the presentation, I will also introduce some data visualization software such as kepler.gl and deck.gl that support large scale data and provide an intuitive interface for creating geospatial visualizations without any coding.
Ashirwad Barnwal
Graduate Research Assistant
I am a transportation data analyst who loves statistics and programming.